DDD Perth 2022 Agenda
Kwoka (Quokka)
Kwonding (Quandong)
Yoorn (Bobtail)
Mangatj (Banksia)
Yiibi (Black Cockatoo)
Mari (Red Gum)
Djakal-Ngakal (Galah)
Bilya (River)
Maali (Black Swan)
7:45 am - 8:40 am
Registration
8:40 am - 8:55 am
Welcome and Housekeeping
8:55 am - 9:10 am
Welcome to Country
9:10 am - 10:00 am
9:10 am - 10:00 am
Kwoka (Quokka)
Christina Aldan
10:00 am - 10:10 am
Changeover
10:10 am - 10:55 am
10:10 am - 10:55 am
Mangatj (Banksia)
Damian Maclennan
10:10 am - 10:55 am
Yiibi (Black Cockatoo)
Ricki Barnes
10:10 am - 10:55 am
Maali (Black Swan)
Phil Wild
10:55 am - 11:25 am
Morning Tea
11:25 am - 12:10 pm
11:25 am - 12:10 pm
Kwoka (Quokka)
Derek Bingham
11:25 am - 12:10 pm
Kwonding (Quandong)
James Hercock, James Trotter
11:25 am - 12:10 pm
Yiibi (Black Cockatoo)
Kristy Haines
11:25 am - 12:10 pm
Maali (Black Swan)
Macklin Hartley
12:10 pm - 12:20 pm
Changeover
12:20 pm - 12:40 pm
12:20 pm - 12:40 pm
Yoorn (Bobtail)
George Coldham, Ke Swen Lee
12:20 pm - 12:40 pm
Mangatj (Banksia)
David Martin
12:20 pm - 12:40 pm
Yiibi (Black Cockatoo)
Cristi Middag
12:40 pm - 12:50 pm
Changeover
12:50 pm - 1:35 pm
12:50 pm - 1:35 pm
Mari (Red Gum)
Troy Gerwien
1:35 pm - 2:35 pm
Lunch
2:35 pm - 3:05 pm
2:35 pm - 3:05 pm
Kwoka (Quokka)
David Meacock, Sarada Lee, Julie Grundy, Christina Aldan, Sam Price
2:35 pm - 3:05 pm
Bilya (River)
Rebecca Waters, Ryan Oakley, Louise Capper, Teresa Watts, Tina Ambrose
3:05 pm - 3:15 pm
Changeover
3:15 pm - 3:25 pm
3:15 pm - 3:35 pm
Kwoka (Quokka)
Megan Pusey
3:15 pm - 3:35 pm
Kwonding (Quandong)
Aish Srinivas
3:15 pm - 3:35 pm
Yoorn (Bobtail)
Jiaranai Keatnuxsuo
3:15 pm - 3:35 pm
Mangatj (Banksia)
Aiden Sobey
3:15 pm - 3:35 pm
Yiibi (Black Cockatoo)
Michelle "MishManners" Duke
3:15 pm - 3:35 pm
Maali (Black Swan)
Sarah McGeough
3:25 pm - 3:35 pm
3:35 pm - 4:05 pm
Coffee Break
4:05 pm - 4:55 pm
4:55 pm - 5:25 pm
Prize Draw
5:25 pm - 5:35 pm
Closing
5:35 pm
DDD Afters
Inclusive storytelling with dynamic data
🕓 11:25 am - 12:10 pm📍 Djakal-Ngakal (Galah)
Recording
Watch on YouTube (opens in a new tab)Since the pandemic we've seen an uptick of charts and data visualisation shared by news, government, and health organisations. Most COVID-19 data was presented as images on social media without alternative text-descriptions, or as interactive charts that were often too complicated to understand, or didn't work with increased font size, keyboards, screen readers, and other assistive devices and settings.
Because of this, many people with disabilities or varying levels of education and data literacy were excluded from receiving important health information—discrimination with fatal consequences.
When we think about data visualisation accessibility, we often think "colour blindness", but what about total blindness? What about using the chart without using a mouse? What about different zoom-levels, font-size and screen widths?
In software, our applications are becoming increasingly data-driven, with lots of great JavaScript libraries that produce beautiful charts—currently (April 2022), however, almost all of them have critical accessibility issues.
In this session we'll design and build a dynamic bar chart component, commonly used in customer-facing applications, and test it with keyboard, screen reader and other accessibility testing tools. We'll also briefly cover alt-text for static images and data visualisations, JS chart library recommendations, and where to learn more.
Speaker
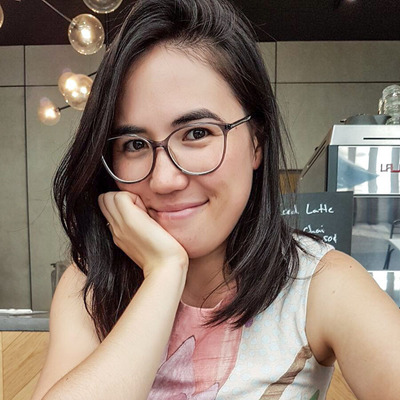
Larene Le Gassick
Product Engineer
Larene is an independent software engineer and consultant, Microsoft MVP in Accessibility, and community manager of Tech Leading Ladies Australia. She specialises in building full-stack applications with accessibility and inclusion at front of mind. She is also an international conference speaker and guest university lecturer on digital accessibility and software architecture. Larene is one of the core members of the [DatavizA11y group](https://github.com/dataviza11y/Why-We-Exist), formed in 2020. Her and other accessibility advocates and experts came together (virtually) to solve for a lack of resources and guidance for making data visualisation inclusive of people with various disabilities, with the goal of raising awareness and providing guidelines and solutions. When she's not building software, you'll find her in a bunch ride or scrolling through Twitter.
2022 Sponsors




Gold